Like all millenials, I’m a big fan of The Office. I was excited to find this dataset via tidytuesday and decided to look at who the highest rated writers and directers are. Spoiler: Mindy Kaling did a lot more than play Kelly Kapoor.
Data for this analysis is from the schrute R package for The Office transcripts and data.world for IMDB ratings of each episode.
Link to Data: https://github.com/rfordatascience/tidytuesday/blob/master/data/2020/2020-03-17/readme.md
I analyzed this data using R; the first section includes downloading and cleaning the data and the second section looks at which writers wrote the most episodes, who was the highest rated writer, and which writer and director combinations get the highest ratings.
Import and Clean Data
You may need to install.packages(“schrute”). The schrute package includes lines by character, the writers, and director for each episode.
library(dplyr)##
## Attaching package: 'dplyr'## The following objects are masked from 'package:stats':
##
## filter, lag## The following objects are masked from 'package:base':
##
## intersect, setdiff, setequal, unionlibrary(schrute)## Warning: package 'schrute' was built under R version 3.6.3library(tidyr)## Warning: package 'tidyr' was built under R version 3.6.3library(ggplot2)The office_ratings.csv includes IMDb ratings for each episode of The Office.
office_ratings <- readr::read_csv('https://raw.githubusercontent.com/rfordatascience/tidytuesday/master/data/2020/2020-03-17/office_ratings.csv')## Parsed with column specification:
## cols(
## season = col_double(),
## episode = col_double(),
## title = col_character(),
## imdb_rating = col_double(),
## total_votes = col_double(),
## air_date = col_date(format = "")
## )episode_text <- schrute::theofficeClean episode_dir_writer to get one record per episode. There is a row for each line, so the director and writer columns are repeated for each line in the episode. For now, we want one row for each writer and director of an episode.
episode_dir_writer <- episode_text[,2:6]

episode_dir_writer <-
  distinct(episode_dir_writer)
We have a different number of lines for the office_ratings df and the episode_dir_writer df. Since there’s one rating for each episode, and now we have one line for each writer and a director of an episode, the dataframes should be the same size.
episode_dir_writer$season_episode <- paste(episode_dir_writer$season, episode_dir_writer$episode)
office_ratings$season_episode <- paste(office_ratings$season, office_ratings$episode)
results1 = setdiff(office_ratings$season_episode, episode_dir_writer$season_episode)
results1
## [1] "3 11" "4 2" "4 4" "4 6" "4 8" "5 2" "5 15" "6 5" "6 18" "7 12"
## [11] "9 23"For two part episodes, episode_dir_writer counts them as two episodes, office_ratings counts them as 1. The episodes above are not in episode_dir_writer because the episode before was two parts and the data goes from episode 10 to 12 to accomodate. We need to create a new episode count for episode_dir_writer where 2 part episodes are counted as 1 episode.
episode_dir_writer$counter <- 1

episode_dir_writer <-
  episode_dir_writer %>%
  group_by(season) %>%
  mutate(episode_reorder = cumsum(counter))

episode_dir_writer$season_episode <- paste(episode_dir_writer$season, episode_dir_writer$episode_reorder)

results2 = setdiff(office_ratings$season_episode, episode_dir_writer$season_episode)
results2
## [1] "6 25" "6 26"office_ratings doesn’t always treat two part episodes the same way (some are 1 record, some are 2). We need to create two rows for two part episodes that are in a single row for season 6 of the episode_dir_writer df (rows 95 & 96, and 108 & 109).
episode_dir_writer %>%
  filter(grepl("Parts 1&2", episode_name)) %>%
  filter(season == 6)
## # A tibble: 2 x 8
## # Groups: season [1]
## season episode episode_name director writer season_episode counter
## <int> <int> <chr> <chr> <chr> <chr> <dbl>
## 1 6 4 Niagara (Pa… Paul Fe… Greg … 6 4 1
## 2 6 17 The Deliver… Seth Go… Danie… 6 16 1
## # … with 1 more variable: episode_reorder <dbl>We duplicate rows so that each two part episode in season 6 is 2 rows.
episode_dir_writer <- rbind(episode_dir_writer, episode_dir_writer[rep(95, 1),])
episode_dir_writer <- rbind(episode_dir_writer, episode_dir_writer[rep(107, 1),])
Then we resort and rerun episode reorder.
episode_dir_writer <-
  episode_dir_writer %>%
  arrange(season, episode) %>%
  group_by(season) %>%
  mutate(episode_reorder = cumsum(counter))

episode_dir_writer$season_episode <- paste(episode_dir_writer$season, episode_dir_writer$episode_reorder)
Then we have the same number and order of episodes, we can merge the tables.
office_data <- merge(episode_dir_writer, office_ratings, by.x = 'season_episode', by.y = 'season_episode')Which Writers Have the Higest Rated Episodes?
In this analysis, we are comparing writers based on their writing credits. There can be more than one writer credit per episode, so there will be some overlap between writers when we compare episode credits and ratings.
Mindy Kaling received the most writer credits, with B.J. Novak and Paul Lieberstein rounding out the top group of writers.
episodes_per_writer <-
  office_data %>%
  select(writer) %>%
  group_by(writer) %>%
  summarise(count_writer = n())

ggplot(episodes_per_writer ) +
  geom_bar(aes(reorder(writer, count_writer), count_writer),
           alpha = 1, stat="identity", fill="steelblue") +
  labs(title="Most Frequent Writers") +
  labs(x="Writer", y="Number of Episodes") +
  theme_gray() +
  theme(axis.text.x = element_text(size = 12),
        axis.text.y = element_text(size = 12),
        plot.title = element_text(size = 18, face = "bold", hjust = 0.5),
        axis.title = element_text(size = 14)) +
  coord_flip()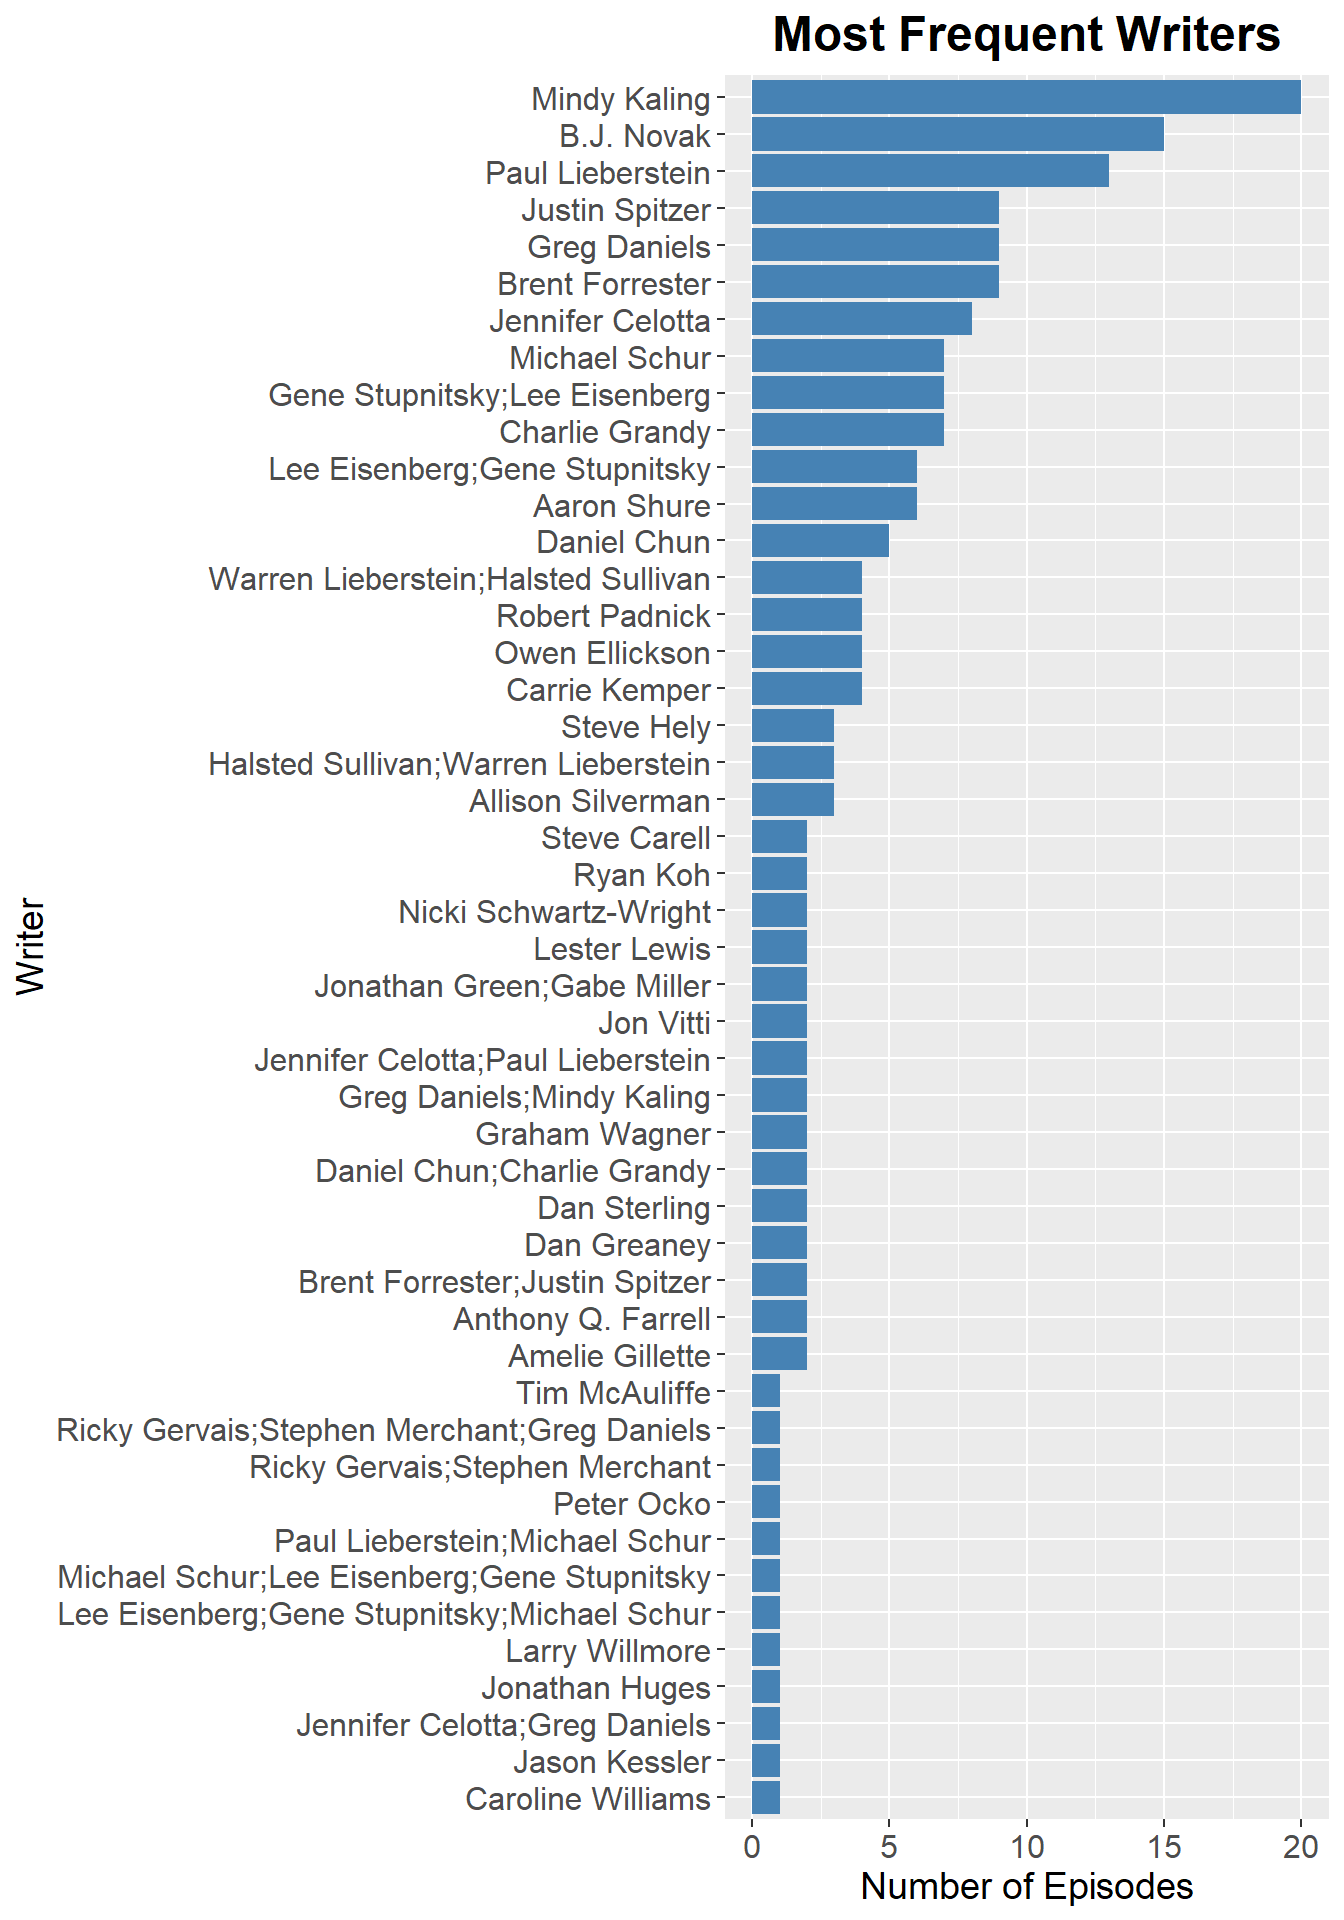
The Paul Lieberstein & Michael Schur team has the highest average rating, followed by the Greg Daniels & Mindy Kaling team. Greg Daniels and Paul Lieberstein also collaborated with Jennifer Celotta on highly rated episodes. Greg Daniels also wrote at least one highly rated episode on his own.
rating_per_writer <-
  office_data %>%
  group_by(writer) %>%
  summarise(imdb_rating = mean(imdb_rating))

ggplot(rating_per_writer) +
  geom_bar(aes(reorder(writer, imdb_rating), imdb_rating),
           alpha = 1, stat="identity",fill="steelblue") +
  labs(title="Highest Rated Writers") +
  labs(x="Writer", y="IMDB Rating") +
  theme_gray() +
  theme(axis.text.x = element_text(size = 12),
        axis.text.y = element_text(size = 14),
        plot.title = element_text(size = 18, face = "bold", hjust = 0.5),
        axis.title = element_text(size = 14)) +
  coord_flip()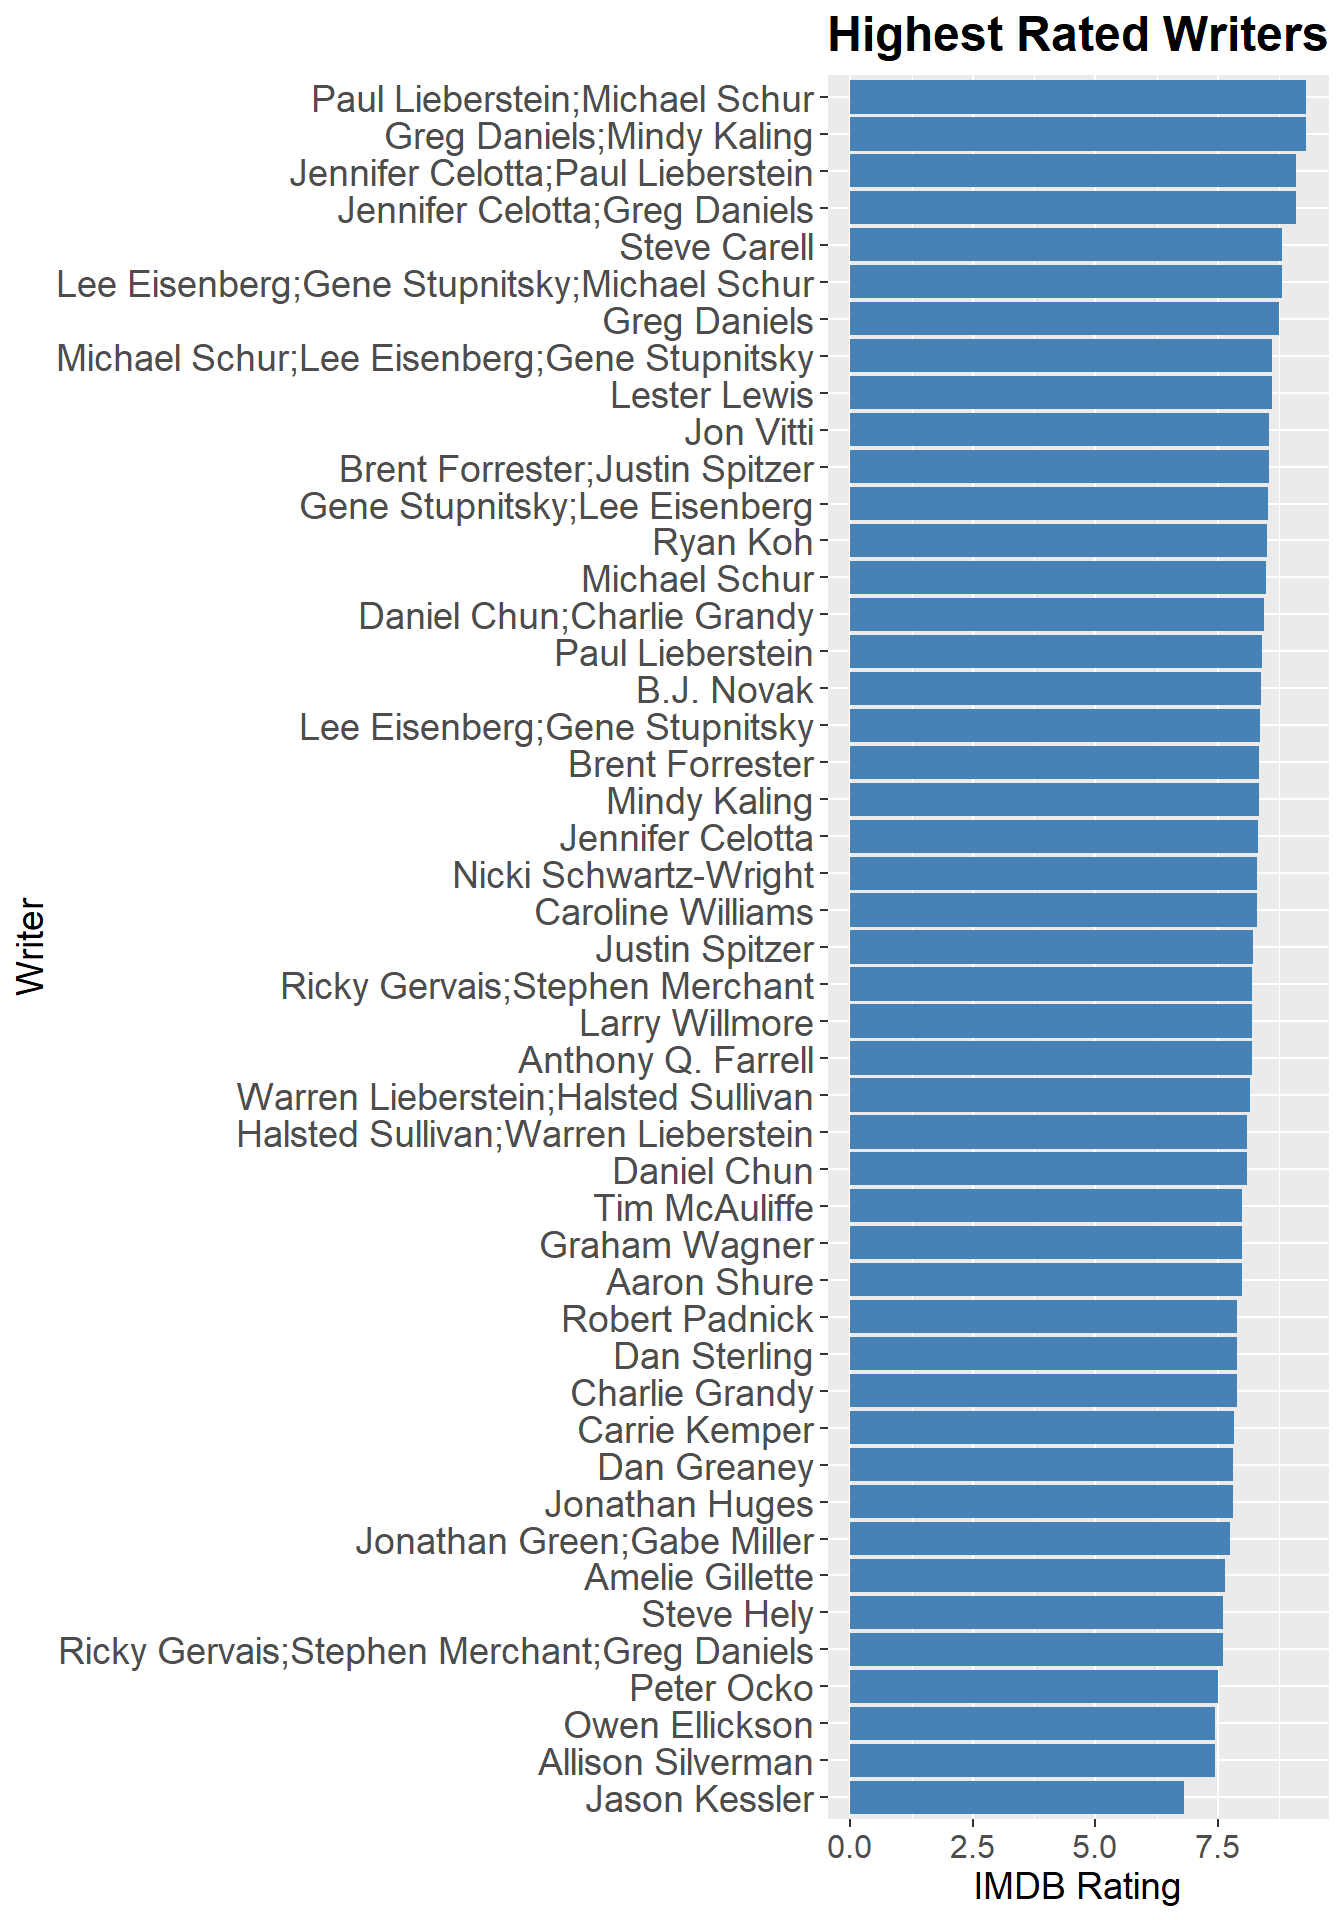
Randall Einhorn, Paul Feig, and Greg Daniels all directed over 12 episodes. There’s also a number of actors who got the chance to direct. B.J. Novak, Steve Carrell, Rainn Wilson, John Krasinski, Mindy Kaling, and Ed Helms all directed a handful of episodes each.
episodes_per_director <-
  office_data %>%
  select(director) %>%
  group_by(director) %>%
  summarise(count_director = n())

ggplot(episodes_per_director) +
  geom_bar(aes(reorder(director, count_director), count_director),
           alpha = 1, stat="identity",fill="steelblue") +
  labs(title="Most Frequent Director") +
  labs(x="Director", y="Number of Episodes") +
  theme_gray() +
  theme(axis.text.x = element_text(size = 12),
        axis.text.y = element_text(size = 12),
        plot.title = element_text(size = 18, face = "bold", hjust = 0.5),
        axis.title = element_text(size = 14)) +
  coord_flip()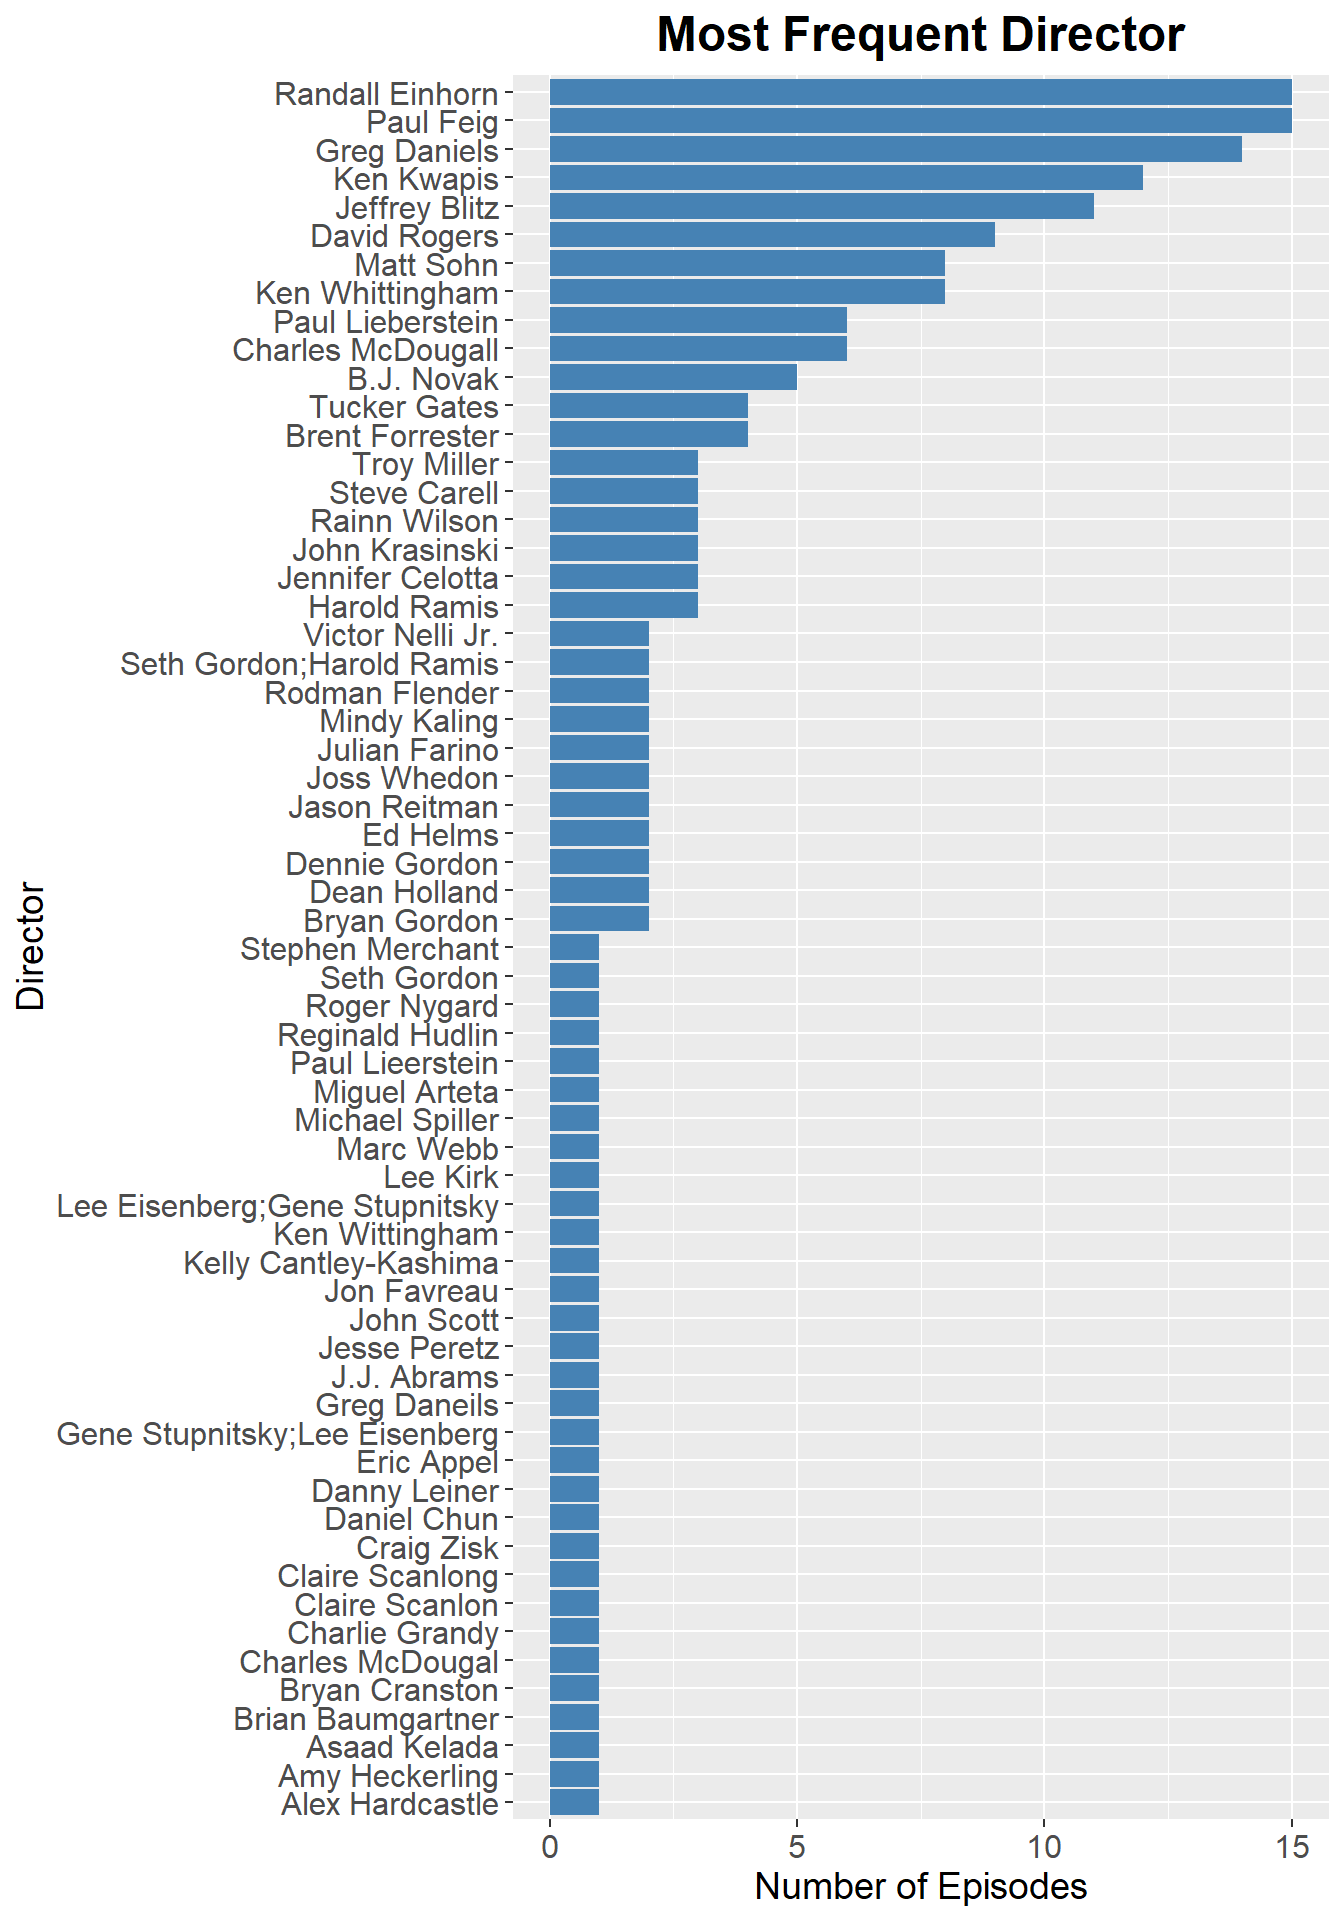
Harold Rarris and Steve Carell have the highest average rating per episode for directors. It’s worth noting that these two didn’t direct too many episodes, less than 5 each. Paul Feig had a high average rating, and directed 15 episodes. The overall spread in average rating for directors is small, the minimum is 7.1, and the maximum is 8.9.
rating_per_director <-
  office_data %>%
  group_by(director) %>%
  summarise(imdb_rating = mean(imdb_rating))

ggplot(rating_per_director) +
  geom_bar(aes(reorder(director, imdb_rating), imdb_rating),
           alpha = 1, stat="identity",fill="steelblue") +
  labs(title="Highest Rated Directors") +
  labs(x="Director", y="IMDB Rating") +
  theme_grey() +
  theme(axis.text.x = element_text(size = 12),
        axis.text.y = element_text(size = 18),
        plot.title = element_text(size = 18, face = "bold", hjust = 0.5),
        axis.title = element_text(size = 20)) +
  coord_flip()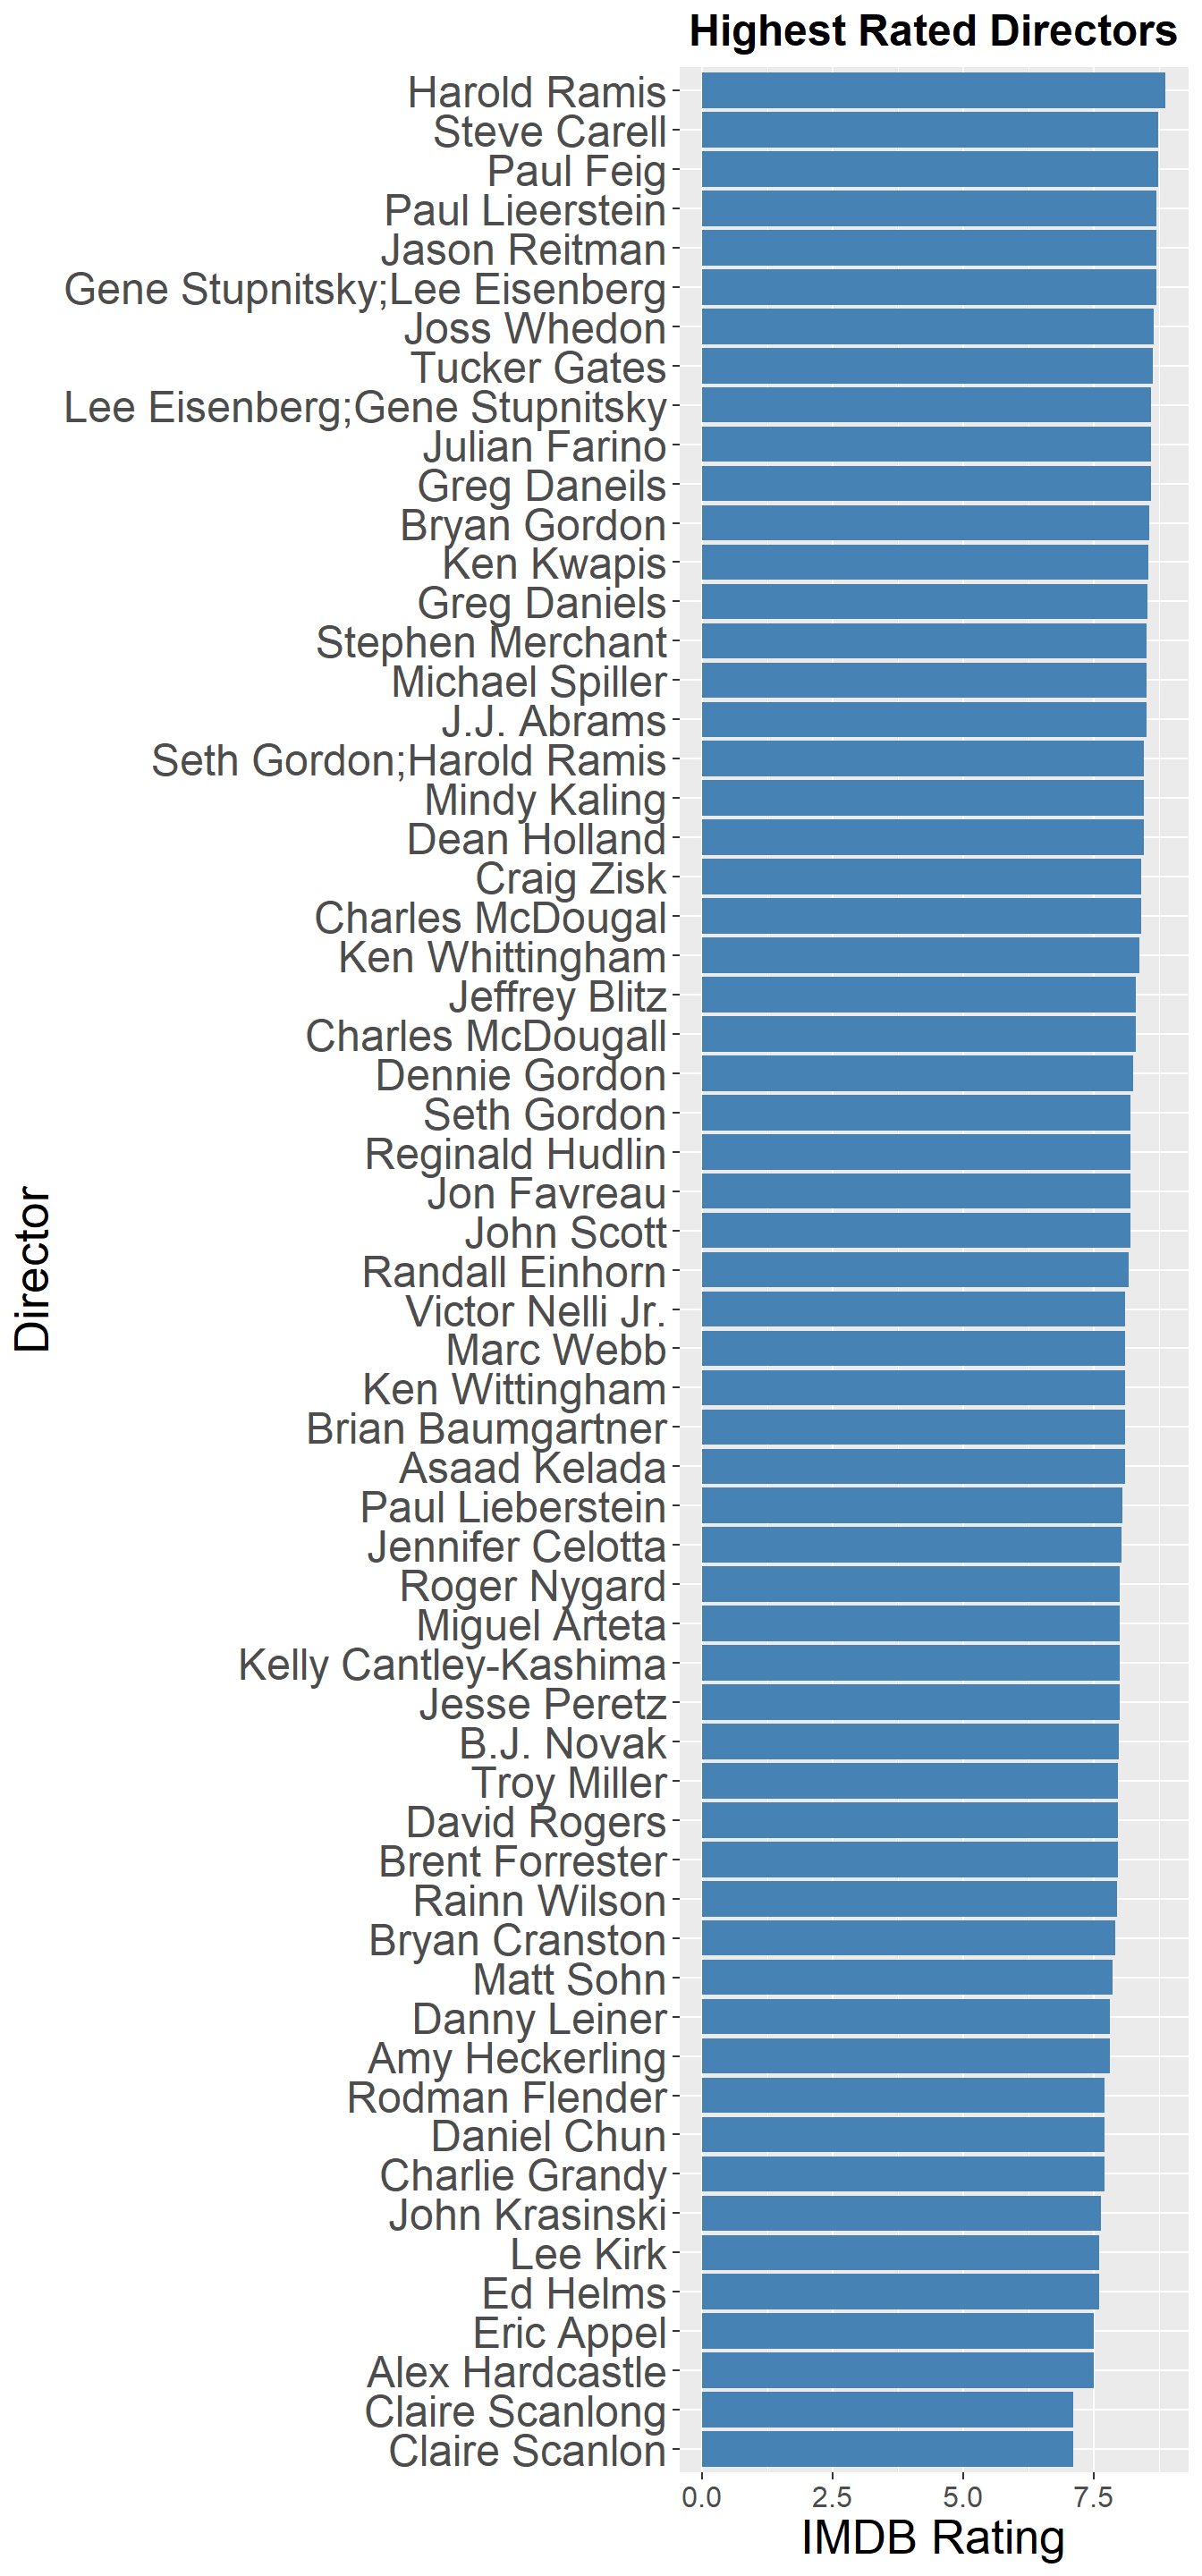
Next I looked at which writer and director together get the highest average rated episodes. The same writers and directors don’t work together that often (more on that below), so the chart only shows groups that had an average rating over 9. For this metric, Greg Daniels and Steve Carell have the highest average rating.
office_data$director_and_writer <- paste(office_data$director, office_data$writer, sep = "&")

rating_per_dir_and_writer <-
  office_data %>%
  group_by(director_and_writer) %>%
  summarise(imdb_rating = mean(imdb_rating))

ggplot(rating_per_dir_and_writer %>% filter(imdb_rating > 9)) +
  geom_bar(aes(reorder(director_and_writer, -imdb_rating), imdb_rating),
           alpha = 1, stat="identity", fill="steelblue") +
  labs(title="Writer & Director Combo") +
  labs(x="Writer & Director", y="IMDB Rating") +
  theme_grey() +
theme(axis.text.x = element_text(angle = 45, hjust = 1)) 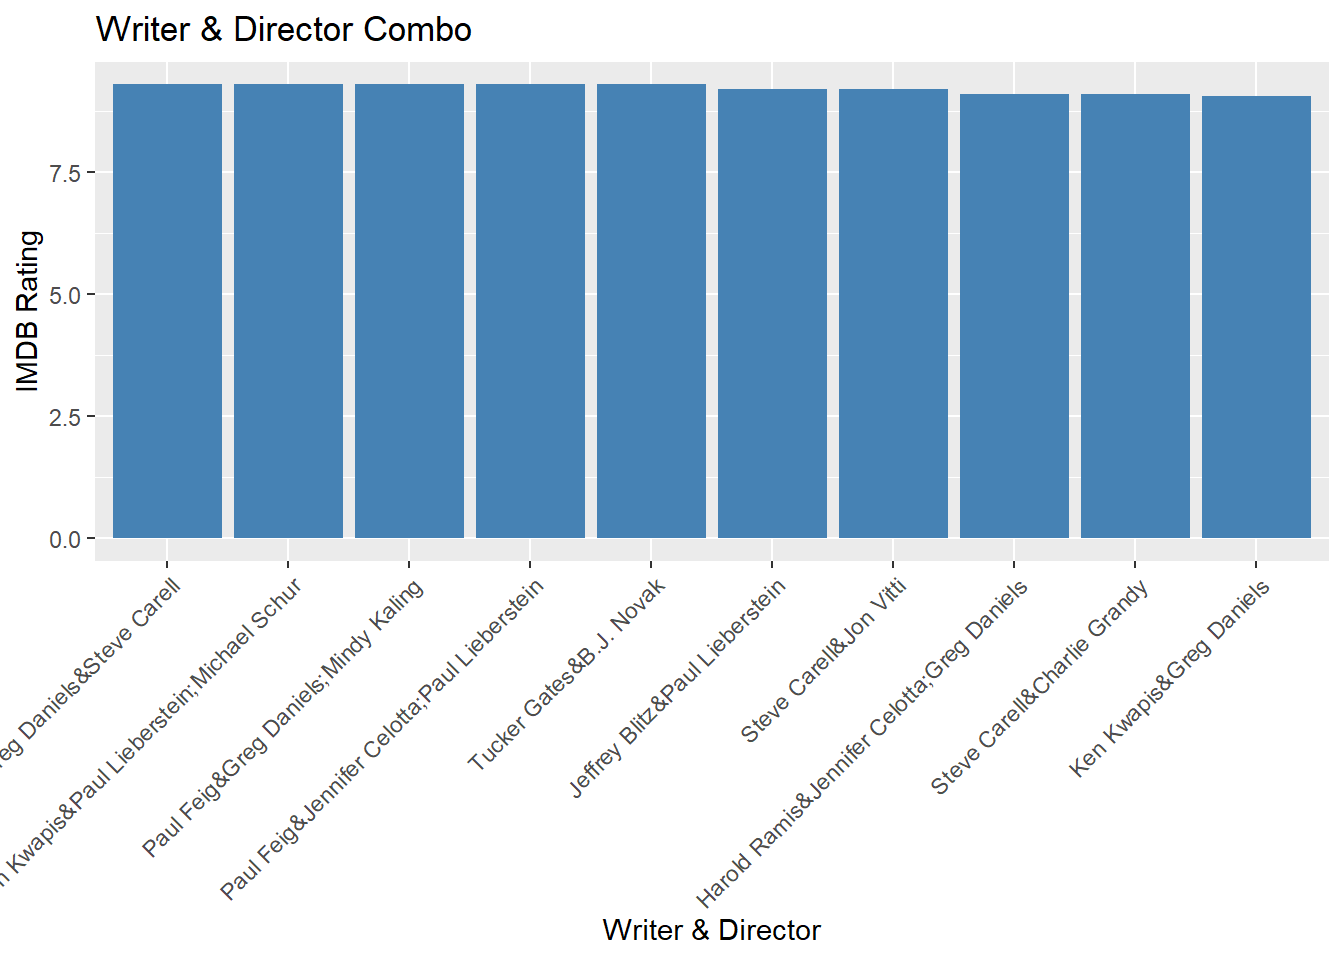
Greg Daniels and Steve Carell only write and direct one episode together, and that episode was Casino Night, a season finale.
office_data %>%
  filter(director == 'Greg Daniels') %>%
  filter(writer == 'Steve Carell') %>%
  nrow()
## [1] 1office_data %>%
filter(director == 'Greg Daniels') %>%
filter(writer == 'Steve Carell')## season_episode season.x episode.x episode_name director writer
## 1 2 22 2 22 Casino Night Greg Daniels Steve Carell
## counter episode_reorder season.y episode.y title imdb_rating
## 1 1 22 2 22 Casino Night 9.3
## total_votes air_date director_and_writer
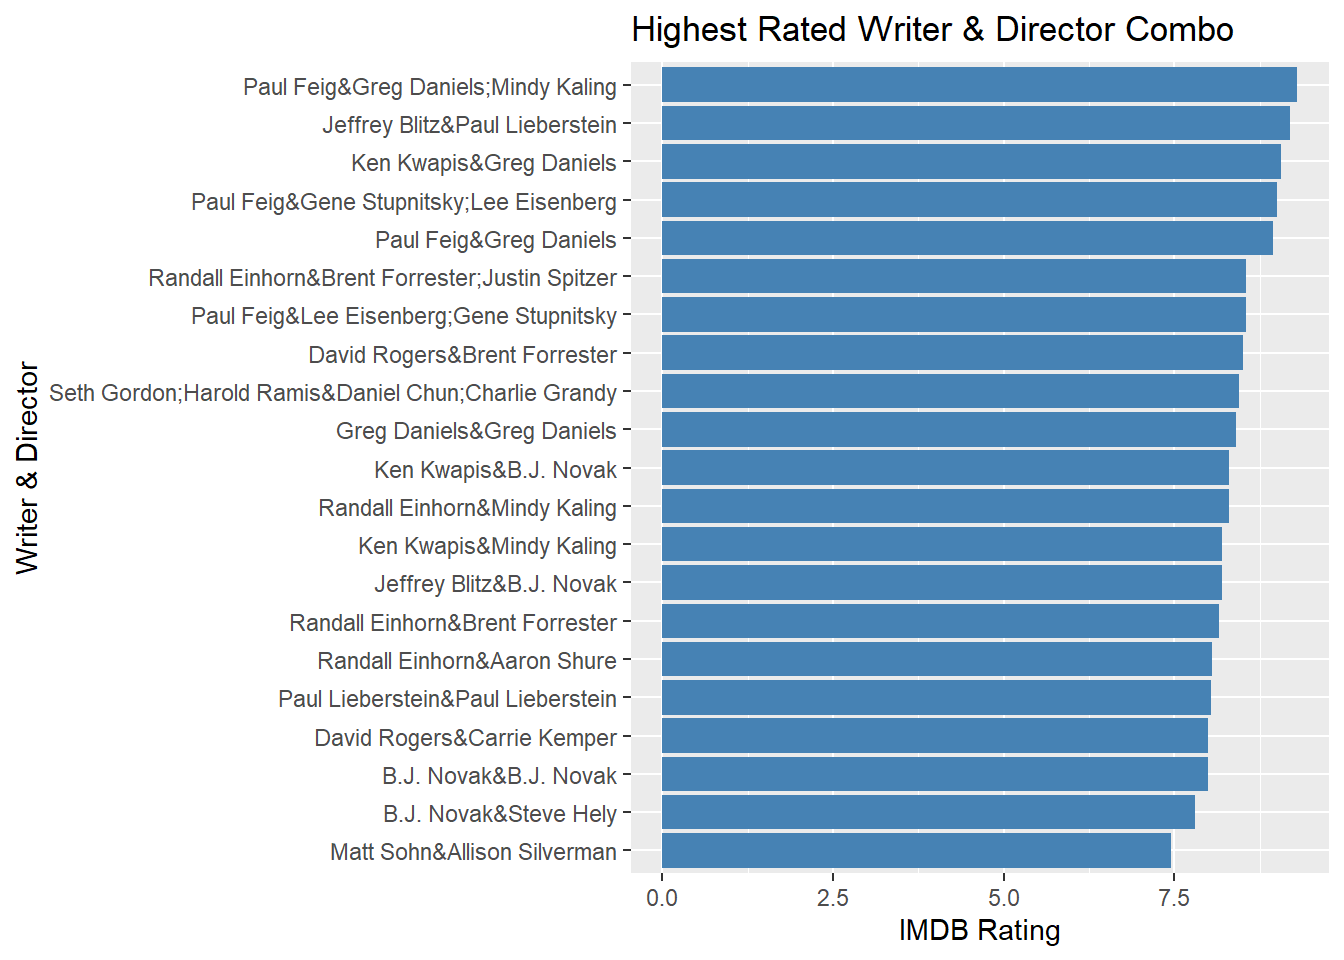
## 1 3644 2006-05-11 Greg Daniels&Steve CarellThe same director and group of writers don’t work together that often. There are only five pairs of writers and directors who work with one another more than twice. Of those who worked together more than once, Paul Feig & Greg Daniels and Mindy Kaling had the highest average rating.
episodes_per_writer_director <-
  office_data %>%
  group_by(director_and_writer) %>%
  summarise(count_director_and_writer = n(),
            imdb_rating = mean(imdb_rating)) %>%
  filter(count_director_and_writer > 1)

ggplot(episodes_per_writer_director) +
  geom_bar(aes(reorder(director_and_writer, imdb_rating), imdb_rating),
           alpha = 1, stat="identity", fill="steelblue") +
  labs(title="Highest Rated Writer & Director Combo") +
  labs(x="Writer & Director", y="IMDB Rating") +
  theme_grey() +
  coord_flip()